Make sure you have accurately completed the answer key.
Make sure that the completed answer key is the first page of the stack to be scanned and that all bubble sheets are facing the same direction and oriented the same way, and then load the stack into the automatic document feeder. For the correct orientation, see the indication on the automatic document feeder or the documentation that came with the printer.
Notes:
- If there are more bubble sheets for the current test than the capacity of the automatic document feeder, load only the maximum number of sheets allowed. On supported printers, you will have an opportunity to scan more sheets during a later step.
- If you are scanning multiple test sets in a single session, make sure you include only one completed answer key, and make sure it is the first page of the entire stack.
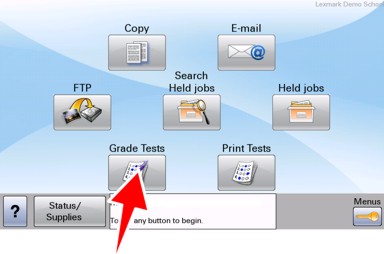
On the printer control panel, touch Grade Tests.
| Note: When you run the application, it first checks for available updates. If an automatic update is required, a message appears to indicate that the printer is downloading and installing a new version of the application. After the update, the printer returns to the home screen. Touch Grade Tests again to continue. |
If your school requires authentication:
Enter the first letter or letters of the user ID provided by your system administrator, and then touch Next.
Select your name or user ID from the list, and then touch Next.
Note: If the list is not close to your name or user ID, you can touch Back and then enter more letters. Enter your password, and then touch Next.
Note: If you see the Welcome to Hosted Testing and Grading screen instead of a password prompt, your user account has not been registered. For more information, see Registering a user account.
Touch Next to begin scanning and grading the tests.
The tests are scanned and graded.
| Note: If the bubble sheets include any blank sheets that were printed without student information, you are prompted to enter identifying information during the grading process if the printer supports it. You can optionally skip entering identifying information. If you choose to enter the information, the identification section of each blank sheet is displayed on the relevant prompt. If you skip entering information or the printer does not support it, then is shown on the reports, where is the sequence number of the blank sheet. |
If the printer supports it, you are prompted to scan more bubble sheets for the current test. If more bubble sheets need to be scanned:
Load the next set of bubble sheets in the automatic document feeder.
Touch Yes.
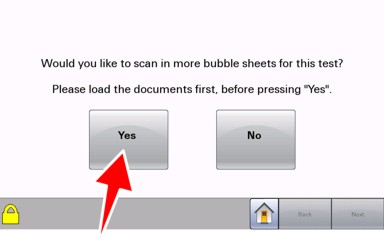
The printer scans the next set of bubble sheets.
If necessary, repeat these steps to finish scanning all bubble sheets.
| Note: On older printers that do not support this feature, this prompt does not appear. If you need to scan more bubble sheets than the capacity of the automatic document feeder, you must use an additional grading session. |
Otherwise, touch No.
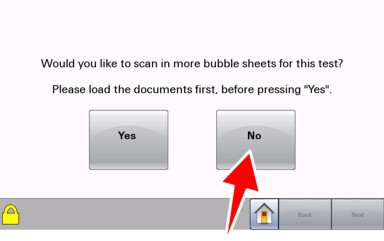
| Note: If you allow this prompt to time out, the tests are graded, and the default report delivery options are used. |
After all test bubble sheets are scanned, the Job Progress screen appears. The scanned sheets are sent to the application, the tests are graded, and then the requested reports are delivered according to your selections.
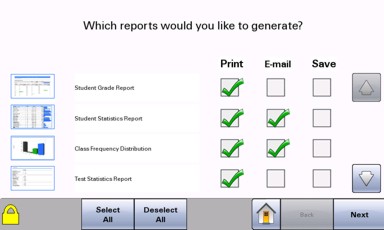
Select which reports to deliver and how they are delivered.
Notes:
- Touch Select All to deliver all tests, or touch Deselect All to clear all selections.
- If you allow this prompt to time out, the tests are graded, and the current selections are used.
- When e-mail notifications are sent, the application can only determine whether the e-mail message is successfully sent to the server. If there are any problems with e-mail delivery, notifications from the server are sent to the e-mail address configured by your network administrator.
The following reports may be available, depending on your configuration:
Report name | Description | Sample |
|---|---|---|
Student Grade Reports | A page for each graded bubble sheet that includes an image of the scanned sheet and a report showing the overall score and a list of responses to each question | 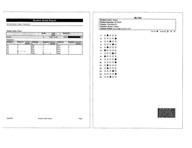 |
Student Statistics Report | A list of scores for each student and the overall mean score | 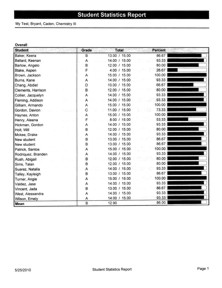 |
Class Frequency Distribution Report | The distribution of letter grades displayed numerically and graphically | 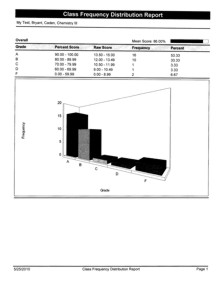 |
Test Statistics Report | Detailed statistics for the overall test |  |
Detailed Item Analysis Report | A large distribution graph of all responses for each test question shown with percentages, frequencies, and point biserial correlations | 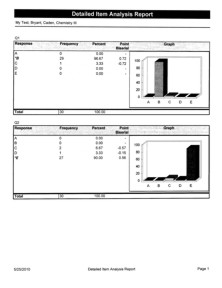 |
CSV Responses and Results | A text-only report containing the following fields separated by commas:
Note: This report is intended for providing raw data for use with other software. It is not printed by default. | B,E,C,C,…,My Test,Bryant,Caden,Chem… Baker,Keera,,B,E,C,D,…,My Test,Brya… Ballard,Keenan,,B,E,C,C,…,My Test,B… Barlow,Angelo,,B,E,C,D,…,My Test,Br… … |
Condensed Item Analysis Report | The frequency and percentage distribution of each response for each test question, shown with a more compact distribution graph | 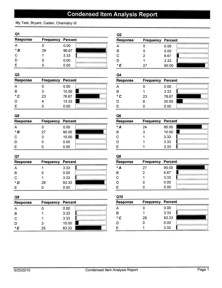 |
Item Analysis Graph Report | A distribution graph of all responses for each test question, shown with percentages | 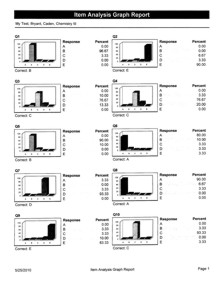 |
Test Item Statistics Report | Correct, incorrect, and missing response totals, as well as reliability, shown as point biserial correlation and p-value, for each test question | 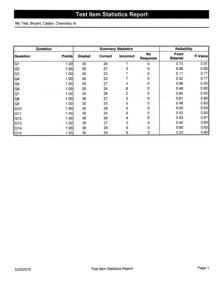 |
If prompted, select whether you want to grade another test.