From the Analytics web portal, click Check out the new Beta Analytics 2.0 here.
Accept the acknowledgement terms.
Select the organization, and then click Next.
Notes:
From the report menu, select Print Outliers (beta).
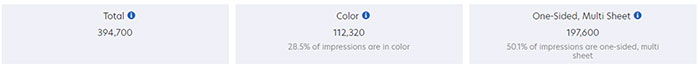
The key performance indicators for print usage include the following:
Total—Shows the total number of print impressions.
Color—Shows the total number of color print impressions.
One Sided, Multi Sheet—Shows the total number of one-sided print impressions on two or more sheets. This data does not include single-page print impressions.
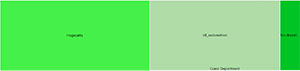
The tree map shows the distribution of print impressions across departments under a particular organization or child organization. On clicking each of the departments in the tree map report, you can get the outlier details of that particular department. In the department outlier, on clicking each of the users, you can get the outlier details of a particular user.
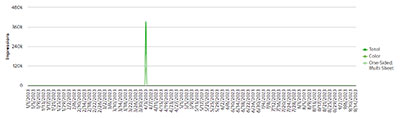
The graph shows the trend in total, colored, and one-sided multi-sheet print impressions across the organization.
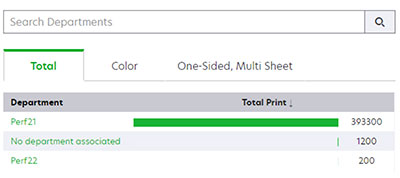
The section shows the list of departments and their corresponding print impressions. You can use the Total, Color, and One Sided, Multi Sheet tabs to view the respective print impressions in each category.
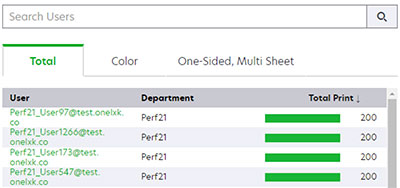
The section shows the list of users and their corresponding print impressions. You can use the Total, Color, and One Sided, Multi Sheet tabs to view the respective print impressions in each category.
Notes: