If you are entitled to Cloud Print Management, then you can access the Print Summary report.
From the Analytics web portal, click Check out the new Beta Analytics 2.0 here.
If you are accessing Analytics 2.0 for the first time, then accept the terms of use.
Select the organization, and then click Next.
Notes:
From the report menu, select Print Summary (beta).
In the insights section, you can view the key highlights on print usage of an organization or a department. It not only highlights key printing patterns but also suggests a probable solution to increase efficiency.
The key performance indicators for print usage can be filtered based on the following:
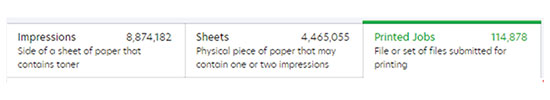
Impressions—Shows the total number of impressions. Filters the print usage report based on the side of a sheet of paper that contains toner.
Sheets—Shows the total number of sheets used. Filters the print usage report based on a physical piece of paper that contains one or two impressions.
Printed Jobs—Shows the total number of print jobs. Filters the print usage report based on the file or set of files submitted for printing.
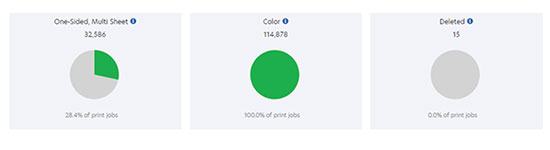
The key performance indicators for print usage include the following:
One Sided, Multi Sheet—Shows impressions, sheets, or printed jobs in one-sided printed jobs of two or more sheets.
For Impressions, the indicator shows the total number of one-sided print impressions on two or more sheets out of the total number of impressions. The one-sided print impressions data does not include single-page print jobs.
For Sheets, the indicator shows the total number of sheets used for simplex printing against the total number of sheets used for printing. The data related to sheets used for simplex printing does not include single-page print jobs.
For Printed Jobs, the indicator shows the total number of simplex print jobs against duplex print jobs.
Color—Shows impressions or printed jobs in color.
For Impressions, the indicator shows the total number of colored and mono impressions.
For Sheets, color sheets are not reported.
For Printed Jobs, the indicator shows total number of color print jobs against mono print jobs.
Deleted—Shows sheets or printed jobs that are deleted.
For Impressions, deleted impressions are not reported.
For Sheets, the indicator shows total number of deleted sheets against the total number of sheets used for printing.
For Printed Jobs, the indicator shows total number of deleted print jobs against the total number of print jobs. Here, print jobs are the ones that are submitted for print release. All print jobs may not be actually printed as some of them may be deleted before print release. Printed jobs are ones that were actually printed.
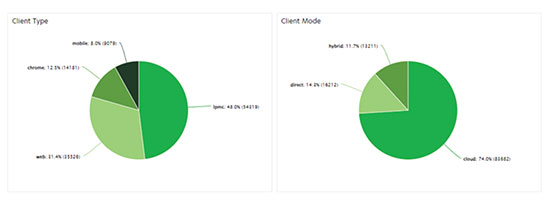
The Client Type chart shows the share for each type of Cloud Print Management submission types. For more information on various types of Cloud Print Management submission, see Managing print queues.
The Client Mode chart shows the share for each type of submitting and releasing print jobs. For more information on various types of submitting and releasing print jobs, see Cloud Print Management overview.
Notes:
The key performance indicators for print jobs can be viewed from the following:
Printed Jobs—Shows the total number of printed jobs in an organization.
Impressions/Printed Jobs—Shows the average number of impressions per print job in an organization.
Sheets/Printed Job—Shows the average number of sheets used per print job in an organization.
Largest Printed Jobs in Organization—Shows a list of users with the largest print jobs in terms of impressions or sheets. This data is available only if you select either the Impressions or the Sheets filter.
Printed Job Size—Shows the percentage of print jobs within a certain range of impression count.
Paper Size—Shows the percentage of print jobs using various paper sizes.
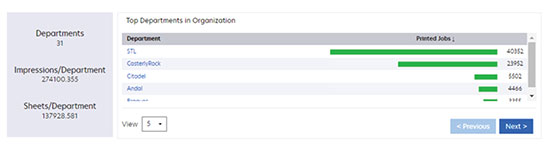
The section shows the list of departments and their corresponding data. The data depends on the filter you have selected. It can be Impressions, Sheets, or Printed Jobs.
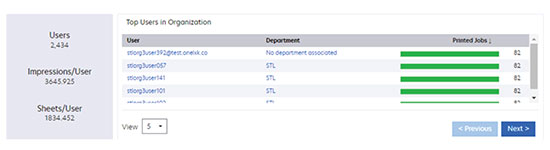
The section shows the list of users and their corresponding data. The data depends on the filter you have selected. It can be Impressions, Sheets, or Printed Jobs.
Notes: